
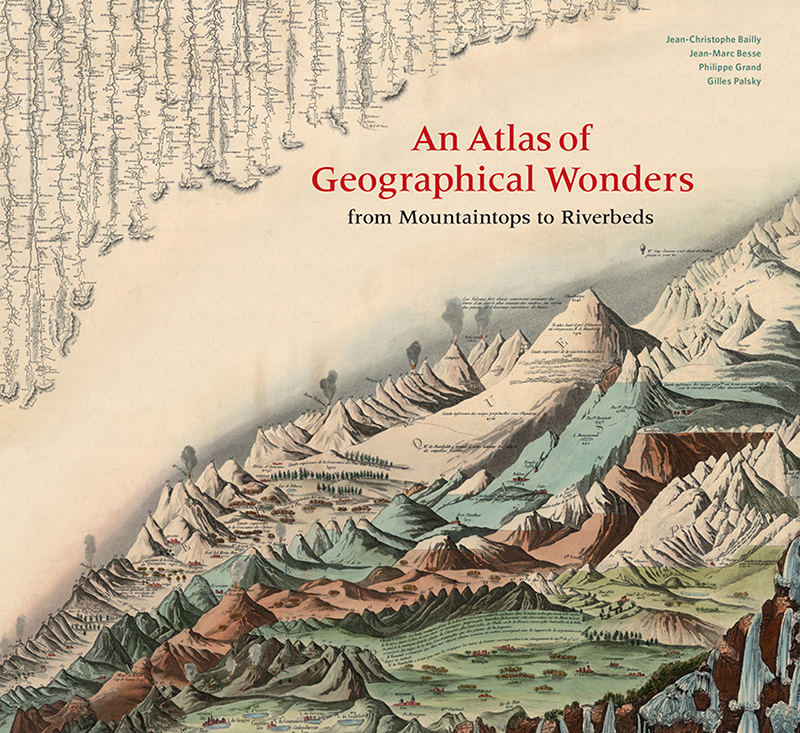
Anyone who wants to understand the origins of the modern infographic will be thrilled to discover An Atlas of Geographical Wonders (Princeton Architectural Press, 2019). This collaboration among some of the most prominent French experts within the realm of cartographic history and preservation—University of Paris geography professor Gilles Palsky; the National Center for Scientific Research’s Jean-Marc Besse; and Jean-Christophe Bailly of the School of Landscape Architecture; along with author Philippe Grand—makes extensive use of Stanford University’s legendary David Rumsey Historical Map Collection to provide readers with perhaps the most comprehensive compendium of nineteenth century maps of mountains, rivers, lakes, and waterfalls. The book offers a compelling view of a discipline that sought to elucidate the physical world at a moment when humanity began to make sense of it through tables and charts—or what we today call “data visualization.”
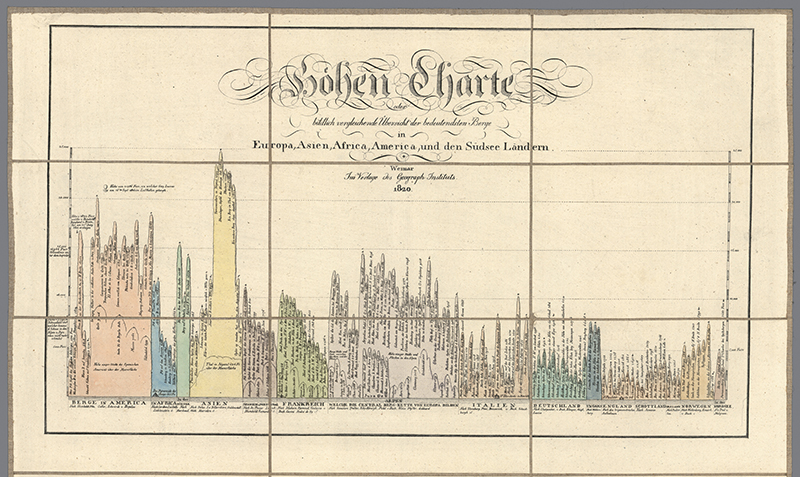
Bailly begins his introductory essay with an appeal to the child in all of us; one who clamors for the sorts of maps that derive their interest from the narrative capabilities and aesthetic properties they manifest, rather than their navigational function. Chief among these would be the comparative tableaux—wherein disparate geographic features are grouped together on a single page—a cartographic genre whose development the book carefully chronicles. Color coding, as represented in Carl Ferdinand Weiland’s map and chart of mountain ranges from 1820, became an important aid in categorization; the first chart to include comparative lists of both mountains and rivers was William Darton’s Comparative Heights of the Principal Mountains and Lengths of the Principal Rivers of 1823. Many would praise the aesthetic pleasures of some of these maps (in particular, the Society for the Diffusion of Useful Knowledge’s 1834 map of major rivers arranged in concentric fashion around an imaginary sea), though one wonders how much of the attraction is based on the inflated value their great age confers on them.
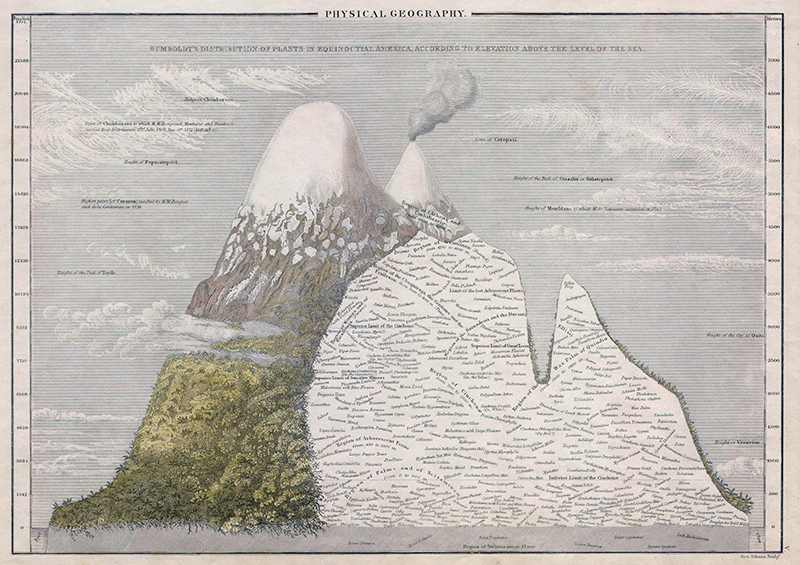
The book also offers a few portraits of the human side of the discipline, trotting out a cast of well-known cartographic characters, most notably Alexander von Humboldt, the influential German explorer and geographer responsible for early measurements of principal peaks in the Andes. The book’s authors suggest that some of the works that came out of Humboldt’s famed 1799–1804 trip to Central and South America, such as his illustrations of the Andes from 1805, laid the groundwork for one of the most recognizable comparative tableau tropes: that of juxtaposing famous and impressive peaks to create fantasy mountain ranges, a technique that would be employed by successive generations of mapmakers.
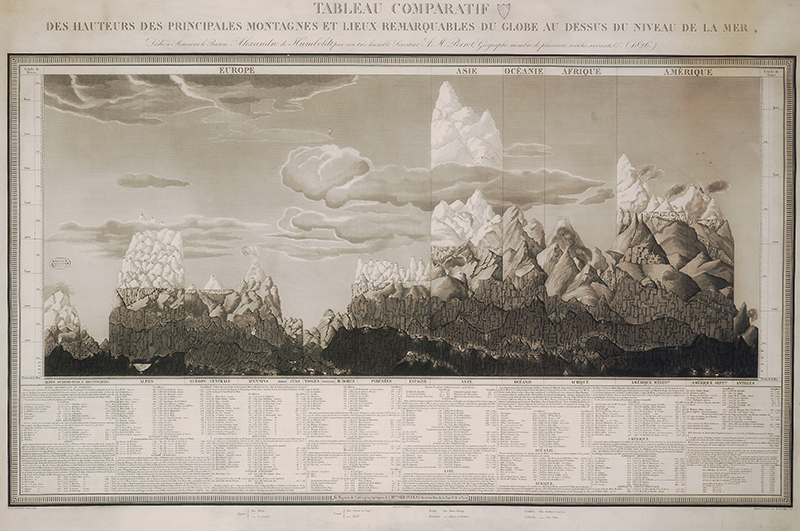
A passage from French geographer Aristide-Michel Perrot’s notes from an 1826 tableau hints at the heuristic choices every cartographer must make to balance accuracy with legibility: “I thought it was suitable to slightly enhance or decrease the heights in the drawing when the scale made it impossible to visually display their differences,” Perrot writes. He elaborates on his process further, candidly admitting that conflicting sources of information account for his—otherwise puzzling—use of “average heights” for each peak listed. Passages like these clue-in readers of An Atlas of Geographical Wonders to the difficulty of translating raw data into text-and-image representations of our world, and underline the fact that what we consider grounded in unflinching certainty today was often pure guesswork as recently as two centuries ago.
An Atlas of Geographical Wonders: From Mountaintops to Riverbeds
Princeton Architectural Press, 2019
208 pp, color illus.
$50